
Why Value, Dividend and Low Volatility Equities Could Outperform in 2023
The sensitivity of value, dividend, low volatility and other key equity styles — or equity risk factors — to changes in economic conditions have increased markedly in the last few years. Although the influences vary from factor to factor and market to market, the economy is driving most of factor-based equity performance. Economic developments — even if not all positive — may work in favor for most of these equity risk factors in 2023. And probably afterwards.
Academic studies[1] have identified six key equity risk factors that have historically outperformed the broad market. They include quality backed by companies with efficient management and strong cash flows, low volatility backed by firms with less volatile cash flows, and out-of-favor value companies. High dividend payers, momentum stocks backed by strong market sentiment, and small caps also have historically outperformed over the long-term.
In the difficult equity market of 2022, the value, high dividend, low volatility and small cap factors outperformed the broad global market (see Exhibit 1), following up on similarly impressive performance in 2021. Quality, along with the others listed above, outperformed the Russell 1000 Index in the U.S.
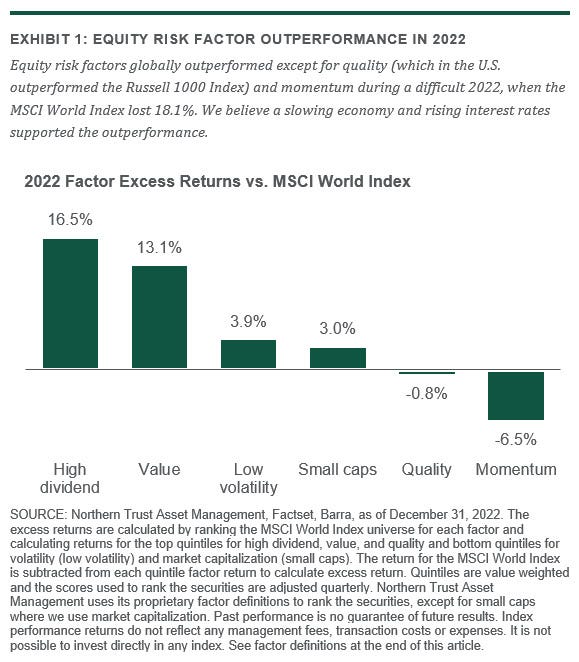
Economic conditions have supported this outperformance. For example, our research shows that defensive factors like quality and low volatility historically have performed their best alongside the combination of slowing economic growth and high stock market volatility. These conditions — the drivers of last year’s market movements along with inflation — elevate uncertainty, which precipitates a “flight to quality” whereby stocks with better financials and lower risk have outsized gains. Similarly, factors like high dividend yield and value have historically performed well in conditions of higher inflation, rising interest rates and declining real economic output.
To see this, consider the typical dividend discount model where the price of a stock is equal to a discounted stream of future dividends. The model uses the discount rate, which determines the current value of cash flows to be received in the future. The higher the discount rate, the less future cash flows are worth. With growth stocks, we generally assume higher dividends further in the future than value and high-dividend-yield stocks, making growth stocks more sensitive to changes in the discount rate.
Rising interest rates mean higher discount rates, which normally puts downside pressure on growth stocks that generally have low dividend yields. Further, growth stock returns historically correlate to dividend growth expectations, which tend to move with the economic cycle. A declining economy in real terms, not including inflation, likely cools future dividend growth expectations, a negative for growth stocks.
So rising interest rates and declining growth may hurt the prospects for growth and portends the relative outperformance of value and high dividend yield stocks.
Sustained high inflation, higher interest rates and slowing economic growth worked in favor of equity factors last year. We think those trends will continue this year, so we anticipate factor performance in 2023 will look a lot like 2022.
A Painful but Important Lesson with Value Investing
The period of factor outperformance over the past two years demonstrates the importance of patience and a focus on long-term performance in investing, even when it comes to factors. For example, from 2014 to 2020, U.S. growth stocks outperformed value stocks every year. The cumulative performance of growth in this period came in at a whopping 178% while value stocks registered a paltry 44%. The worst year, by far, was 2020, when growth stocks hauled in a 38% return and value gained just 3%. Not surprisingly, it was also in this year we heard the loudest “value is dead” and “this time is different” rhetoric, not at all unlike what we heard during the dot-com era circa 1999.
But value didn’t die and this time wasn’t really all that different. In fact, value behaved exactly as it had done in the past and, we think exactly as it should have. Exhibit 2 begins to illustrate these points. This is an excellent visual depiction of the value cycle in U.S. stocks going back to 1973. Do you see the remarkable regularity? While it’s true the length of the cycle differs from cycle to cycle, the pattern is striking. Each cycle begins with a number of years of value outperformance, typically six or seven years, followed by two or three years of value underperformance and, hence, growth outperformance.
Note also the extremes. Both the beginning and end of value cycles are punctuated by outsized returns. This phenomenon is the origin of the factor investing mantra: “It’s always darkest before dawn.” Or, put another way: “It’s always coldest before spring.” This was appropriate for 2020 when value lagged by nearly 40% but then rebounded by nearly 30% in both 2021 and 2022.

Also, pay attention to the bottom of the graph which shows the annualized return of value over each cycle and note all the figures are positive. That’s what makes factor investing so interesting. It’s not quite a free lunch, but you likely will get paid for the risk you take, if you can sustain the ups and downs.
Factors Have Cycles Too
While we’ve focused on value, all factors go through cycles. These cycles can vary in length but the economic variables we described above often dictate their patterns. Consider the post-vaccine announcement euphoria of late 2020. The prospect of emergence from a pandemic economy sparked a “junk rally” where risky, low-quality securities significantly outperformed their low volatility, high quality counterparts. However, in the following months the performance trends reversed — and over the full cycle quality and low volatility outperformed low-quality securities.
Historically, all factors have demonstrated this type of cyclicality and outperformance over the cycle. With most of these factors, we think we’re in the early stages of a multi-year cycle with several, if not many, years of positive returns yet to come.
Some Caution Warranted
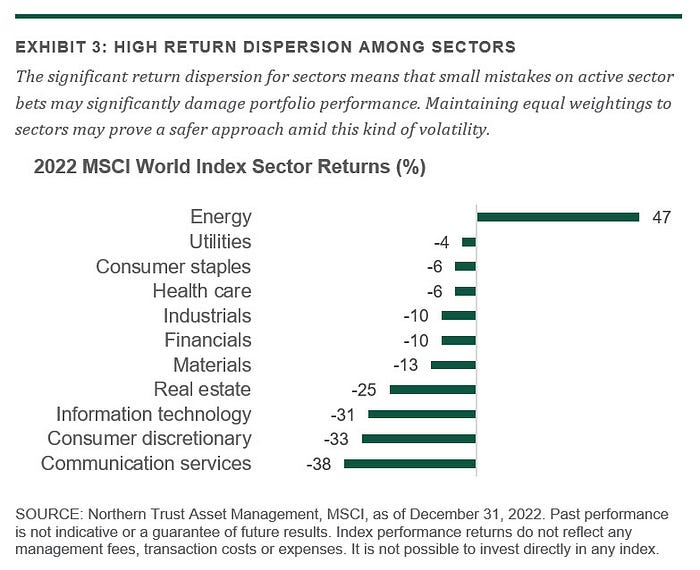
While we foresee continued strong factor performance in 2023, we do so with a bit of caution. We expect the global equity market to remain volatile, which also supports continued volatility for equity market components such as sectors, countries and currencies. Exhibit 3 details the 2022 sector performances of global large cap stocks. Last year, the energy sector posted a 47% return while communication services lost 38%, for a spread of 85%! This tremendous dispersion left little room for error. Small mistakes by investors in sector allocation likely damaged performance tremendously.
Factor portfolios, if naively implemented, tend to take on a lot of sector, region and currency biases. Given the heightened volatility of these exposures, we feel that best practices in factor investing minimize these sources of risk. Over the long term, these exposures historically have added materially to the total risk of the portfolio but not to the total return, which is what we call “uncompensated”.
Under the current economic climate, we believe investors need to be particularly vigilant about getting paid for the risks they take. Or in other words, take compensated risks. With a bit of prudent portfolio construction, investors can harness the power of factors and make the most of the difficult economic conditions they face in 2023.
Learn more about active quantitative equity investing at Northern Trust Asset Management.
Glossary
The quality factor targets companies with efficient management, profitability and strong cash flows.
The value factor targets companies that trade at low current valuations.
The low volatility factor targets companies with less volatile cash flows.
The momentum factor targets companies that have strong market sentiment and analyst sentiment.
The size (small cap) factor targets companies of smaller market capitalization.
The dividend yield (high dividend) factor targets companies that pay large dividends.
The Russell 1000 Index measures the performance of the large-cap segment of the U.S. equity universe.
The MSCI World Index captures large and mid-cap representation across 23 developed markets countries.
[1] Choi, James R and Zhao, Kevin. “Did Mutual Fund Return Persistence Persist?” The National Bureau of Economic Research. Issued January 2020.
IMPORTANT INFORMATION. For Asia-Pacific markets, this information is directed to institutional, professional and wholesale clients or investors only and should not be relied upon by retail clients or investors. The information is not intended for distribution or use by any person in any jurisdiction where such distribution would be contrary to local law or regulation. Northern Trust and its affiliates may have positions in and may effect transactions in the markets, contracts and related investments different than described in this information. This information is obtained from sources believed to be reliable, and its accuracy and completeness are not guaranteed. Information does not constitute a recommendation of any investment strategy, is not intended as investment advice and does not take into account all the circumstances of each investor. Opinions and forecasts discussed are those of the author, do not necessarily reflect the views of Northern Trust and are subject to change without notice.
This report is provided for informational purposes only and is not intended to be, and should not be construed as, an offer, solicitation or recommendation with respect to any transaction and should not be treated as legal advice, investment advice or tax advice. Recipients should not rely upon this information as a substitute for obtaining specific legal or tax advice from their own professional legal or tax advisors. Information is subject to change based on market or other conditions.
Forward-looking statements and assumptions are Northern Trust’s current estimates or expectations of future events or future results based upon proprietary research and should not be construed as an estimate or promise of results that a portfolio may achieve. Actual results could differ materially from the results indicated by this information.
Past performance is no guarantee of future results. Performance returns and the principal value of an investment will fluctuate. Performance returns contained herein are subject to revision by Northern Trust. Comparative indices shown are provided as an indication of the performance of a particular segment of the capital markets and/or alternative strategies in general. Index performance returns do not reflect any management fees, transaction costs or expenses. It is not possible to invest directly in any index. Net performance returns are reduced by investment management fees and other expenses relating to the management of the account. Gross performance returns contained herein include reinvestment of dividends and other earnings, transaction costs, and all fees and expenses other than investment management fees, unless indicated otherwise. For additional information on fees, please refer to Part 2a of the Form ADV or consult a Northern Trust representative.
All securities investing and trading activities risk the loss of capital. Each portfolio is subject to substantial risks including market risks, strategy risks, adviser risk and risks with respect to its investment in other structures. There can be no assurance that any portfolio investment objectives will be achieved, or that any investment will achieve profits or avoid incurring substantial losses. No investment strategy or risk management technique can guarantee returns or eliminate risk in any market environment. Risk controls and models do not promise any level of performance or guarantee against loss of principal. Any discussion of risk management is intended to describe Northern Trust’s efforts to monitor and manage risk but does not imply low risk.
Northern Trust Asset Management is composed of Northern Trust Investments, Inc. Northern Trust Global Investments Limited, Northern Trust Fund Managers (Ireland) Limited, Northern Trust Global Investments Japan, K.K, NT Global Advisors, Inc., 50 South Capital Advisors, LLC, Belvedere Advisors LLC, Northern Trust Asset Management Australia Pty Ltd, and investment personnel of The Northern Trust Company of Hong Kong Limited and The Northern Trust Company.
© 2023 Northern Trust Corporation. Head Office: 50 South La Salle Street, Chicago, Illinois 60603 U.S.A.
P-030723–2753230–030624

Weekly Investment Commentary: Munis offer yield relief from inflation’s heat
U.S. yields began the year at their highest starting level since 2011, and they have since risen further across the Treasury and municipal curves.

Global Weekly Commentary: Higher bar for U.S. earnings to deliver
We saw 2024 as a year of two stories. First, cooling inflation and solid corporate earnings would support upbeat risk appetite.

Global Markets Weekly Update: April 19, 2024
Review the performance of global stock and bond markets over the past week, along with relevant insights from T. Rowe Price economists and investment professionals.