
When Diversification Fails
KEY INSIGHTS
- As in past episodes of extreme market volatility, correlations across many asset classes spiked higher during the sell-off caused by the coronavirus pandemic.
- As markets and economies recover, investors face the question of when—and how—to increase portfolio exposure to equities and other risk assets.
- U.S. Treasuries, gold, and volatility strategies historically have been effective hedges. However, the limitations of each also should be considered.
One of the most vexing problems in investment management is that the benefits of portfolio diversification can seem to disappear just when they are needed most.
The coronavirus crisis provided a fresh example of this tendency. When global markets sold off in March, return correlations among different asset classes and sectors spiked as investors sold indiscriminately. “There were few places to try to hide other than U.S. Treasuries, gold, and the U.S. dollar as a perceived safe‑haven currency,” says Anna Dreyer, head of fixed income risk and portfolio construction research.
“Every time we get into a crisis, people seem surprised when correlations that normally are in the 0%–50% range suddenly jump to the 90%+ range,” adds Sébastien Page, head of global multi‑asset.1 “This risk is very much underestimated, even by the savviest investors.”
As an example, Page cites historical correlations between U.S. and non‑U.S. equities. From January 1979 through February 2008 (near the beginning of the global financial crisis), he says, the correlation of returns between the two asset classes was actually negative (‑17%) in months when both rallied strongly (i.e., by more than one standard deviation, a statistical measure of variability) from the average for such periods.2
By contrast, in periods where both asset classes suffered losses that were more than one standard deviation from the average, the monthly correlation rose to 76%.
THE BENEFITS OF DIVERSIFICATION CAN DISAPPEAR WHEN THEY ARE NEEDED MOST
(Fig. 1) Global asset class returns

In declines greater than two standard deviations from the average, Page adds, the correlation rose to 93%—demolishing virtually all diversification benefits.
Risk assets, including equities, credit, many commodities, and emerging market currencies, all sold off in March, Dreyer noted, suggesting a rise in correlations and supporting the argument that a failure of diversification also applied to the March sell-off.
Beware of “Regime Change”
Investors often rely on correlation averages across long historical periods when constructing portfolios, Page notes. But markets and economies both tend to move through distinct periods of calm and turbulence. These correlation “regimes” may last for extended periods.
“Shifts between regimes are hard to predict,” Page says. This can leave investors exposed to tail risk—unlikely but extreme events at either end of the probability distribution of potential market outcomes.
U.S. TREASURIES HISTORICALLY HAVE BEEN STRONG DIVERSIFIERS IN MARKET CRISES
(Fig. 2) Rolling 12-month correlations of 10-year Treasury note and S&P 500 Index1
January 1, 1981, through May 31, 2020.
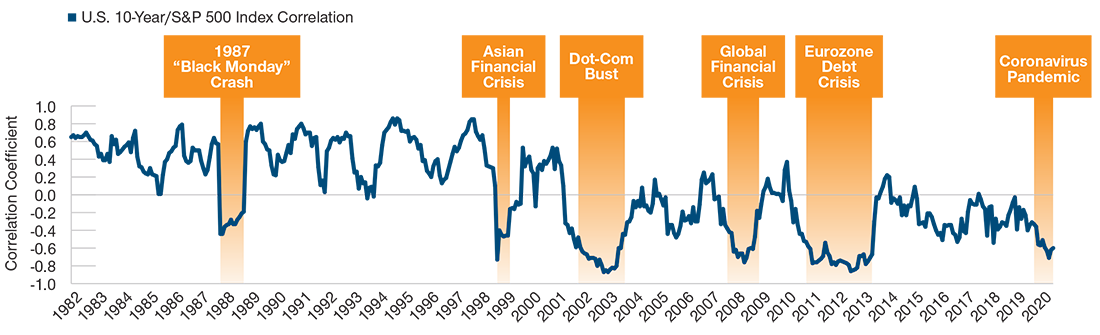
Over the past two decades, long‑term U.S. Treasuries were one of the relatively few hedges against tail risk that typically performed well amid market volatility, notes Rick de los Reyes, portfolio manager for Macro and Absolute Return Strategies.
Falling interest rates and positive carry (i.e., a positive differential between short‑term and long‑term rates) also made U.S. Treasuries an attractive diversifier, de los Reyes adds.
"It looks like U.S. Treasuries likely will be less effective as a hedge against tail risk in the future…"— Rick de los Reyes
Portfolio Manager, Macro and Absolute Return Strategies
Dreyer notes that it is less clear whether those benefits will be as attractive in the future. During the worst of the March sell-off, the nominal 10‑year U.S. Treasury yield fell below 1% for the first time. With Federal Reserve policy rates now close to zero and the Fed showing little interest in taking rates negative, U.S. Treasuries may offer only meager returns going forward, de los Reyes adds. “It looks like U.S. Treasuries likely will be less effective as a hedge against tail risk in the future, which is unfortunate.”
U.S. Treasuries and the S&P 500 Index have not always been as negatively correlated as they have been over the last 20 years, Dreyer notes. In the 1970s, for example, the correlation typically was positive.
Arif Husain, head of international fixed income, says he believes longer‑duration assets, including U.S. Treasuries, will continue to work as portfolio hedges against market volatility. “When a crisis happens, people will still look for the highest-quality assets,” he argues.
However, Husain agrees with de los Reyes that the impact of the coronavirus crisis in driving down yields could mean that from here such assets could offer much lower returns than they have historically.
Two other potential hedges historically have performed well in periods of equity and credit market volatility but also have their limitations in more normal periods.
Gold, de los Reyes argues, is potentially an effective long‑term hedge, but can be less reliable over shorter‑term periods.
Gold prices often have fallen in the early stages of past market crises but typically have rebounded more quickly during recoveries. This also has been the pattern so far during the coronavirus crisis, de los Reyes says.
INTEREST RATES: HOW LOW CAN THEY GO?
(Fig. 3) Federal funds rate versus 2- and 10-year Treasury yields
January 1983 through May 2020.

Past performance is not a reliable indicator of future performance.
Source: Federal Reserve Board/Haver Analytics.
Another potential hedge against equity volatility, de los Reyes notes, is to anticipate an increase in volatility using derivative instruments.
Historically, certain derivative instruments, such as put options, have been strong hedges in a crisis, de los Reyes says. However, the costs—such as premiums on options contracts—can be punitively high in more normal market periods.
Options contracts also may expire worthless, de los Reyes notes.
The Role of Liquidity Risk
Liquidity risk—the possibility that investors may not be able to find buyers for assets they urgently need to sell—can be the primary culprit when diversification benefits disappear during periods of extreme market volatility.
Page uses the analogy of a burning building: To get out of the building, investors need to find a buyer willing to take their place inside the building—not an easy task in the middle of a crisis.
Indeed, in periods of extreme volatility, price declines may be worse for higher‑quality assets, because those may be the only ones that can be traded at all. “When investors need liquidity, they sell everything in their portfolio that’s liquid,” Page says. “So all liquid assets sell off at the same time, no matter what the differences are in their fundamentals.”
Waves of indiscriminate selling may cause asset prices to “gap”—change dramatically between one transaction and the next—and push correlations higher across the board, Page notes.
Financial reforms imposed after the global financial crisis may have made liquidity problems worse, especially in corporate credit markets, de los Reyes says.
Higher capital requirements have made broker-dealers less willing to hold relatively risky securities in inventory. As a result, more assets may be offered for sale when markets are declining, “We saw that in February and March of this year, even in the Treasury market,” de los Reyes says. “Eventually the Fed had to step in, because no one else wanted to buy.”
Private Assets and Their Limitations
Many investment consultants and other analysts argue that private equity and other assets that are not traded in public markets have diversification characteristics that potentially make them highly effective hedges against market volatility.
Citing the results of conventional mean/variance optimization (an analytical tool used in asset allocation), some private-equity advocates contend that the asset class may be essentially a “free lunch” that potentially can deliver high returns, low volatility, and low correlation to the economic cycle.
MARCH SELL-OFF WAS THE MOST RAPID OF THE PAST 10 BEAR MARKETS
(Fig. 4) S&P 500 bear markets, 1960 to present
March 19, 1962, through June 18, 2020.

Past performance is not a reliable indicator of future performance.
1 7/16/90 included even though sell-off fell just short of -20% bear market threshold.
But the diversification benefits of private assets are more apparent than real, Page argues. “It’s a mirage, at least in part,”
he says.
Because most private assets are not valued in markets on an ongoing basis, the return and correlation data fed into an asset allocation analysis may be unreliable, Page says—especially if those returns are based on internal rate‑of‑return3 calculations that include unrealistic assumptions about reinvestment rates.
Page says he does believe that diversification across both public and private assets can be useful when appropriate. However, he argues that private asset allocations need to take into account mark‑to‑market risk—the possibility that assumed valuations could be inaccurate or stale—even though that risk can be very difficult to estimate.
Stepping Back Into Risk
As markets and economies continue to recover from the coronavirus pandemic, investors will face the question of when—and how—to increase portfolio exposure to equities and other relatively risky asset classes.
From a strategic perspective, Page argues, investors should remain diversified for the long run. From a tactical perspective, however, they may be able to seek opportunities during a downturn and in the early stages of a market recovery by leaning into risk assets.
T. Rowe Price research, he adds, suggests that, historically, it has not been especially important whether investors successfully timed the bottom of a market downturn.
“We looked at 17 equity sell-offs of 15% or more in the S&P 500 Index over the last 80+ years prior to the coronavirus crisis, and we found that being as much as one month early or one month late in buying stocks around the absolute bottom still could have added significant value across those 17 sell-offs,” Page observes. “The success rate was 100%.”4
CREDIT SPREADS WIDENED SHARPLY
(Fig. 5) U.S. high yield spread history1
January 3, 1997, through May 31, 2020.

Past performance is not a reliable indicator of future performance.
Although the market outlook depends heavily on the course of the pandemic and the strength of the global economic recovery, Page says he believes investors who have added to their positions during the downturn and in the initial stages of the market rebound could be rewarded this time as well.
That said, Page suggests that investors should use scenario analysis—based on correlations during crisis periods, not just longer‑term average correlations—in their portfolio construction process.
Keeping a Close Eye on the Fed
As they contemplate potential tactical adjustments in their portfolio allocations, investors also may want to pay close attention to monetary policy, de los Reyes suggests. “One clear lesson from this crisis is that being a Fed watcher is even more important than in the past,” he says.
“The Fed’s ability to tame volatility should not be underestimated,” de los Reyes adds.
"One clear lesson from this crisis is that being a Fed watcher is even more important than in the past."— Rick de los Reyes
Portfolio Manager, Macro and Absolute Return Strategies
However, the Fed can only do so much to improve the outlook for corporate credit, Husain says. While the U.S. central bank has restored liquidity in many markets by purchasing securities to hold on its own balance sheet, such injections by themselves cannot repair the damage done to corporate balance sheets by the crisis.
“[Fed] Chairman [Jerome] Powell has made it very clear that liquidity does not equal solvency,” Husain notes. “So I think we will continue to see defaults.” For investors, he adds, this means that strong bottom‑up fundamental credit research will remain essential to successful security selection.
For professional portfolio managers, the Fed’s various buying programs have created potential opportunities in distressed fixed income sectors, according to de los Reyes. Since the start of the crisis, he notes, the Fed has extended its purchases to a progressively broader range of fixed income sectors: first Treasuries, then mortgage‑backed and asset‑backed securities, then investment‑grade corporate bonds, and more recently even high yield bonds.
“Our strategy has been to try to stay one step ahead of the Fed by buying assets at dislocated prices and then potentially benefiting as the Fed stepped in and those markets started to normalize,” de los Reyes says.
Disciplined Diversification Can Help
Although asset correlations followed their past historical pattern by spiking toward 100% in the depths of the coronavirus sell-off, the most damaging problem for many investors wasn’t that diversification failed during the crisis but that their portfolios weren’t sufficiently diversified going into the crisis, Husain contends.
“Too many investors lost the discipline of pure diversification,” Husain says. “They switched from Treasuries into things they believed were very similar to Treasuries—like investment‑grade credit—only to discover that they weren’t that similar during a crisis.”
Investors had many opportunities to add diversification and hedge risk before the crisis, Husain says, at a time when many indicators of expected volatility, such as the Chicago Board Options Exchange’s Volatility Index, were trading at historically low levels.
“It’s painful sacrificing potential returns,” Husain says. “But in the real world, we believe the worst time to try to diversify is when markets already are in crisis.
1 Correlations are a measurement of how one asset class, style or individual group are related to each other. A perfect positive correlation means that the correlation coefficient is exactly 1 (or 100%). This implies that as one security moves, either up or down, the other security moves in lockstep, in the same direction. A perfect negative correlation (-100%) means that two assets move in opposite directions, while a zero correlation (0%) implies no relationship at all.
2 U.S. stocks were represented by the Morgan Stanley Capital International (MSCI) U.S. Total Return Index, and non-U.S. stocks were represented by the MSCI Europe, Australasia, and Far East Total Return Index in local currencies.
3 The internal rate of return is the interest rate that makes the present value of cash flows from an investment equal to zero.
4 To identify what constituted a “sell-off event,” we used S&P 500 Index price data from January 3, 1928, through January 30, 2020, to calculate the drawdowns from a previous peak and then identified the dates with the largest drawdowns corresponding to each peak. From that, we implemented a 15% maximum drawdown threshold in order to find the historical dates that have had major sell-offs. We then measured subsequent returns over 12 months for stocks in the S&P 500 Index one month before and one month after the absolute bottom. The success rate represents the percent of times that stocks had positive returns. For more on the study methodology, please see: “Investing in Equities Amid a Crisis,” T. Rowe Price Asset Allocation Insights, May 2020. For illustrative purposes only; not indicative of any specific investment. Investors cannot invest directly in an index.
Additional Disclosure
All data and content on the HFR website and in the HFR Database products are for your informational and personal use only. The total return data provided on the HFR website, the HFR Database products, and the reports generated from them are for internal, non-commercial use only. The data is not sufficient, comprehensive enough or approved for use in connection with investment products or instruments. You may not copy, redistribute, sell, retransmit, or make the data available to a third party, or otherwise use it for any commercial or public purpose unless you have a separate written agreement with HFR. You require a written license from HFR to use the HFR data, HFR marks and names and/or HFR Index names, including but not limited to use in connection with investment products and instruments (regardless of whether such products or instruments are based on, linked to or track an HFR Index), the name of investment products and instruments, in prospectuses, marketing and other materials publicly or commercially disseminated, benchmarking purposes, and any SEC, government or regulatory filings. Please contact HFR for additional information at: INDICES@HFR.COM.
London Stock Exchange Group plc and its group undertakings (collectively, the “LSE Group”). © LSE Group 2020. FTSE Russell is a trading name of certain of the LSE Group companies. “Russell®” is a trade mark of the relevant LSE Group companies and is used by any other LSE Group company under license. All rights in the FTSE Russell indexes or data vest in the relevant LSE Group company which owns the index or the data. Neither LSE Group nor its licensors accept any liability for any errors or omissions in the indexes or data and no party may rely on any indexes or data contained in this communication. No further distribution of data from the LSE Group is permitted without the relevant LSE Group company’s express written consent. The LSE Group does not promote, sponsor or endorse the content of this communication. The LSE Group is not responsible for the formatting or configuration of this material or for any inaccuracy in T. Rowe Price Associates’ presentation thereof.
MSCI and its affiliates and third party sources and providers (collectively, “MSCI”) makes no express or implied warranties or representations and shall have no liability whatsoever with respect to any MSCI data contained herein. The MSCI data may not be further redistributed or used as a basis for other indices or any securities or financial products. This report is not approved, reviewed, or produced by MSCI. Historical MSCI data and analysis should not be taken as an indication or guarantee of any future performance analysis, forecast or prediction. None of the MSCI data is intended to constitute investment advice or a recommendation to make (or refrain from making) any kind of investment decision and may not be relied on as such.
Copyright © 2020, S&P Global Market Intelligence (and its affiliates, as applicable). Reproduction of any information, data or material, including ratings (“Content”) in any form is prohibited except with the prior written permission of the relevant party. Such party, its affiliates and suppliers (“Content Providers”) do not guarantee the accuracy, adequacy, completeness, timeliness or availability of any Content and are not responsible for any errors or omissions (negligent or otherwise), regardless of the cause, or for the results obtained from the use of such Content. In no event shall Content Providers be liable for any damages, costs, expenses, legal fees, or losses (including lost income or lost profit and opportunity costs) in connection with any use of the Content. A reference to a particular investment or security, a rating or any observation concerning an investment that is part of the Content is not a recommendation to buy, sell or hold such investment or security, does not address the suitability of an investment or security and should not be relied on as investment advice. Credit ratings are statements of opinions and are not statements of fact.
Bloomberg Index Services Limited. BLOOMBERG® is a trademark and service mark of Bloomberg Finance L.P. and its affiliates (collectively “Bloomberg”). BARCLAYS® is a trademark and service mark of Barclays Bank Plc (collectively with its affiliates, “Barclays”), used under license. Bloomberg or Bloomberg’s licensors, including Barclays, own all proprietary rights in the Bloomberg Barclays Indices. Neither Bloomberg nor Barclays approves or endorses this material, or guarantees the accuracy or completeness of any information herein, or makes any warranty, express or implied, as to the results to be obtained therefrom and, to the maximum extent allowed by law, neither shall have any liability or responsibility for injury or damages arising in connection therewith.
ICE Data Indices, LLC (“ICE DATA”), is used with permission. ICE DATA, ITS AFFILIATES AND THEIR RESPECTIVE THIRD-PARTY SUPPLIERS DISCLAIM ANY AND ALL WARRANTIES AND REPRESENTATIONS, EXPRESS AND/OR IMPLIED, INCLUDING ANY WARRANTIES OF MERCHANTABILITY OR FITNESS FOR A PARTICULAR PURPOSE OR USE, INCLUDING THE INDICES, INDEX DATA AND ANY DATA INCLUDED IN, RELATED TO, OR DERIVED THEREFROM. NEITHER ICE DATA, ITS AFFILIATES NOR THEIR RESPECTIVE THIRD-PARTY SUPPLIERS SHALL BE SUBJECT TO ANY DAMAGES OR LIABILITY WITH RESPECT TO THE ADEQUACY, ACCURACY, TIMELINESS OR COMPLETENESS OF THE INDICES OR THE INDEX DATA OR ANY COMPONENT THEREOF, AND THE INDICES AND INDEX DATA AND ALL COMPONENTS THEREOF ARE PROVIDED ON AN “AS IS” BASIS AND YOUR USE IS AT YOUR OWN RISK. ICE DATA, ITS AFFILIATES AND THEIR RESPECTIVE THIRD-PARTY SUPPLIERS DO NOT SPONSOR, ENDORSE, OR RECOMMEND T. ROWE PRICE OR ANY OF ITS PRODUCTS OR SERVICES.
Information has been obtained from sources believed to be reliable but J.P. Morgan does not warrant its completeness or accuracy. The index is used with permission. The Index may not be copied, used, or distributed without J.P. Morgan’s prior written approval. Copyright © 2020, J.P. Morgan Chase & Co. All rights reserved.
Important Information
This material is provided for informational purposes only and is not intended to be investment advice or a recommendation to take any particular investment action.
The views contained herein are those of the authors as of July 2020 and are subject to change without notice; these views may differ from those of other T. Rowe Price associates.
This information is not intended to reflect a current or past recommendation concerning investments, investment strategies, or account types, advice of any kind, or a solicitation of an offer to buy or sell any securities or investment services. The opinions and commentary provided do not take into account the investment objectives or financial situation of any particular investor or class of investor. Please consider your own circumstances before making an investment decision.
Derivatives typically involve risks different from, and possibly greater than, the risks associated with investing directly in the assets on which the derivative is based. Certain derivatives can be highly volatile, lack liquidity, be difficult to value, involve counterparty risk, may be considered speculative and are not suitable for everyone. Changes in the value of a derivative may not properly correlate with changes in the value of the underlying asset, reference rate, or index. Private assets are considered speculative therefore subject to a unique set of risks; they are not suitable for everyone. These risks include, but are not limited to, potential illiquidity and lack of a secondary market to trade securities, management risk, concentration and non-diversification risk, foreign investment risk, lack of transparency, leverage risk, and volatility. Investing in private companies involves greater risk than investing in stocks of established publicly traded companies. Gold is subject to increased risks such as higher price volatility and geopolitical risks.
Information contained herein is based upon sources we consider to be reliable; we do not, however, guarantee its accuracy.
Past performance is not a reliable indicator of future performance. All investments are subject to market risk, including the possible loss of principal. Diversification cannot assure a profit or protect against loss in a declining market. Fixed-income securities are subject to credit risk, liquidity risk, call risk, and interest-rate risk. As interest rates rise, bond prices generally fall. Investments in high-yield bonds involve greater risk of price volatility, illiquidity, and default than higher-rated debt securities. All charts and tables are shown for illustrative purposes only.
T. Rowe Price Investment Services, Inc.
© 2020 T. Rowe Price. All rights reserved. T. ROWE PRICE, INVEST WITH CONFIDENCE, and the bighorn sheep design are, collectively and/or apart, trademarks or registered trademarks of T. Rowe Price Group, Inc.

Peeling back the onion: A concentric approach to investment decision making
Portfolio Managers Greg Wilensky and Jeremiah Buckley offer a framework for interpreting economic news for investment decision making.

What is ESG and why do we care?
Michelle Dunstan, Janus Henderson’s Chief Responsibility Officer, explores ESG considerations and highlights how ESG integration helps Janus Henderson deliver on client goals and aspirations.

Hiding in plain sight: The investment case for healthcare
Though healthcare may have flown under the market’s radar this year, the sector’s attractive valuations and new growth opportunities are not to be overlooked, say Portfolio Managers Andy Acker and Dan Lyons.