
Investment Perspective: Taking the Under
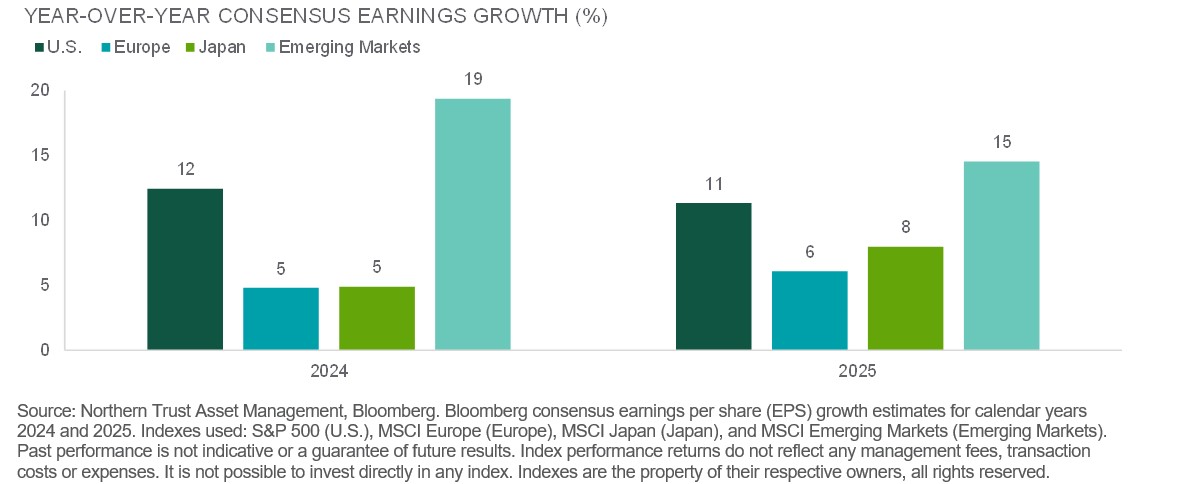
Global equities were roughly flat over the past month against a flattish backdrop for interest rates, with non-U.S. equity markets trailing due to a strengthening of the U.S. dollar. U.S. large cap growth stocks continued to outperform, masking softness in value and small caps when looking at broader indices. Investor optimism remains on display in the U.S. for both earnings and valuations. Earnings estimates continue to edge higher – now equating to roughly 12% growth in 2024 and 2025, while the forward P/E multiple sits at an elevated 19x. We are taking the under on economic growth and earnings forecasts given accumulating global headwinds.
The U.S. consumer remains durable when looking at retail sales and payment network volume trends, however, depleting savings and increasing revolving debt levels have supported recent spending capacity. Going forward, we expect spend will have to slow to align with wage growth. In addition, we still expect the lagged effect of monetary policy to act as an incremental headwind – further suppressing activity.
Inflation measures ticked up this month, due in part to higher energy prices (oil prices are making new year-to-date highs). We continue to believe the market will be disappointed by the timing and pace of interest rate cuts from central banks, including the Fed. Inflation should continue its disinflationary path and the European Central Bank and the Fed are likely close to done raising rates, but we do not expect central banks to be in a hurry to remove restrictive interest rate policy via interest rate cuts.
China continues to struggle as the consumer retrenches in the wake of the property market unwind. To date, governmental support has been modest, supporting our underweight to the region. We are watching closely to see if China’s woes lead to an exporting of economic weakness or further disinflationary forces – further hurting the economic growth outlook.
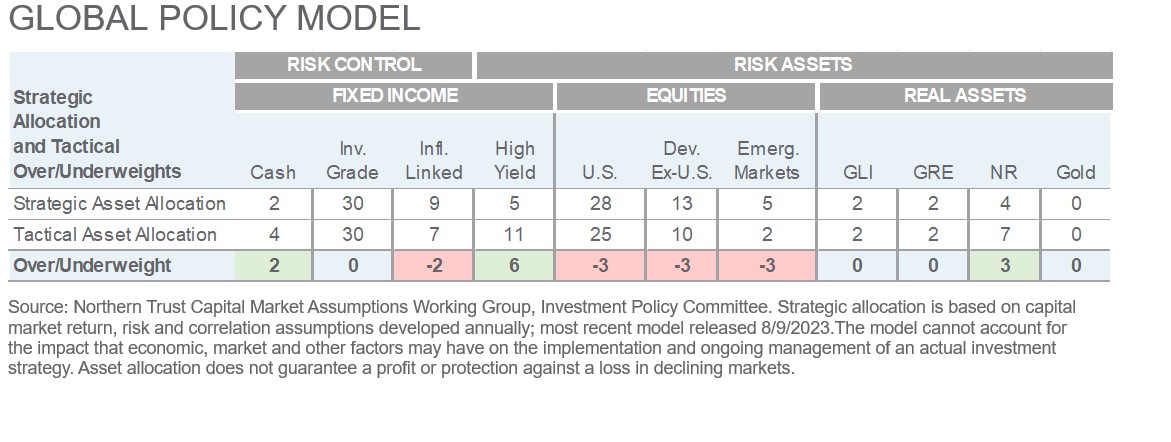
We made no changes to our Global Policy Model this month, maintaining our relatively modest underweight to risk. We continue to prefer high yield bonds to developed market equities, natural resources to emerging market equities, as well as an overweight to cash.
- Chris Shipley, Chief Investment Strategist of North America
PERFORMANCE EQUALS REALITY MINUS EXPECTATIONS?
Elevated earnings growth expectations for the next two years leave room for disappointment.
Interest Rates
Usage of an important Federal Reserve facility, the Reserve Repo Facility (RRP), has been on the decline since May. Initially launched in 2013, the RRP allows a specific set of investors, primarily money market mutual funds (MMFs), to park cash at the Fed in exchange for Treasuries as collateral. A combination of declining Treasury Bill (T-Bill) supply and higher policy rates made the RRP attractive to MMFs, with total RRP usage peaking at over $2.5 trillion. So what’s driving the decline now?
First, T-Bill supply has surged since the debt ceiling deal. There was risk that the rebuild of the Treasury General Account could drain too much liquidity from the banking system, but instead we’ve seen an orderly shift of liquidity via MMF allocations to more T-Bills and less RRP. Also, there has been an uptick in demand from dealers to borrow cash in the repo markets as they compete with the RRP. Overall, the decline in RRP usage is a good reminder that Quantitative Tightening (QT) continues, and that at some point the Fed will need to consider if it has drained enough liquidity – from the RRP and elsewhere – as well as shrunk its balance sheet to an appropriate size. We will continue to monitor the RRP for any signals around market liquidity and future balance sheet policy.
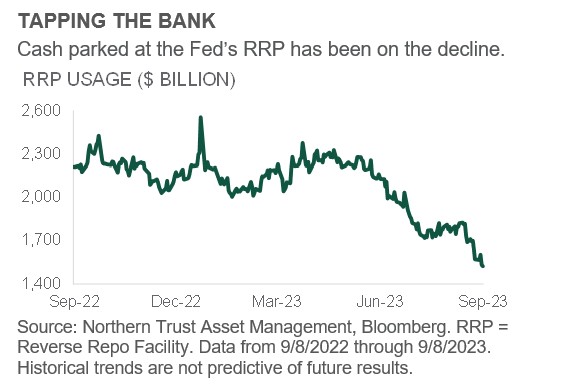
- After an 18-month surge, cash parked at the Fed via the RRP has been on the decline this year.
- Cash from the RRP has mitigated liquidity drainage from the rebuild of the Treasury General Account.
- We hold a neutral view toward duration as inflation risks loom but downside risk to rates is growing.
Credit Markets
While fundamentals are the primary driver of performance for high yield, technicals can also be important drivers of performance, especially during periods of limited market activity. After depressed primary activity last year (which was the lowest since 2018), issuance has picked up modestly so far this year, but overall it remains low compared to historical averages.
Limited supply the past two years has been one of the factors driving tighter spreads throughout the year and especially during the summer months. This technical is illustrated in the total par amount outstanding within the high yield bond universe, which has shrunk ~13% to $1.4 trillion, compared to a peak of $1.6 trillion in October of 2021. Investors have been looking towards September – a seasonally busy month for primary issuance – to potentially ease the supply technical. Estimates of up to $25 billion of supply are elevated versus the monthly average of $13 billion this year, but they remain below the 5-year average for September of $30 billion. Additionally, the pipeline of supply has been well-telegraphed to the market so investors are likely well-positioned in terms of slightly elevated cash balances to absorb this supply. Valuations could remain stable due to these offsetting factors.
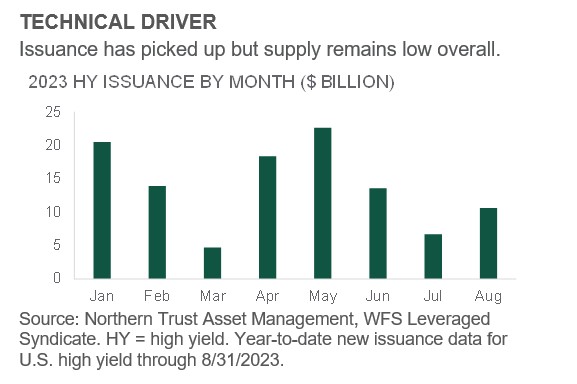
- Low new issuance relative to historical averages has supported a 7% return for high yield year-to-date.
- High yield investors likely have cash on the sidelines that can absorb a modest uptick in supply.
- We hold a preference for high yield (+6%) over equities (-6% developed markets) in our Global Policy Model.
Equities
The global equity rally stalled last month and even reversed some, with global equities posting a 0.5% loss. Regionally, the pattern of U.S. and Japan outperforming Europe and emerging markets continued. Also, growth stocks continued to outperform value-oriented names.
An important driver behind the weakness in Europe and emerging markets is persistent disappointment in economic growth. Real economic activity data is coming in below expectations, forward-looking indicators continue to decline and earnings expectations are being revised down. In the U.S. and Japan the opposite is true: economic performance has been slightly better than expected (see chart) and earnings expectations have been modestly revised upwards. Looking forward, however, we continue to see financial markets as being overly confident that the U.S. economy in particular can pull off a soft landing. The consumer’s capacity to spend is slowly diminishing and the impact of tight monetary policy is growing with the credit cycle losing momentum. As a result, we believe incremental disappointment on both the economic and earnings front are more likely than continued upside surprises, which is why we remain underweight all three major equity regions (3% each).
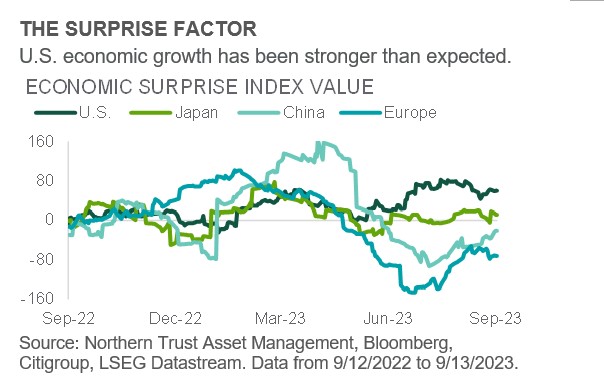
- Economic results have helped U.S. and Japan equity returns, but not so much for Europe and China.
- With investors increasingly optimistic on a soft-landing economic outcome, we see room for disappointment.
- We maintain a 3% underweight to each U.S., developed ex-U.S., and emerging market equities.
Real Assets
Equities and commodities have had a give-and-take relationship over the decades with equity price returns doing well when commodity price returns don’t – and vice versa. The 1970s saw commodities beating equities by 17.5% per year – only for the 1980s to largely reverse that, with equities beating commodities by an annualized 17.2%. Commodity prices continued to sputter in the 1990s – but not equities, which outperformed by an annualized 8.4%. Commodities regained their footing in the 2000s – running ahead by 14.7% per year (in a decade with negative equity performance from start to end) – only to stall out during the 2010s, underperforming equities by an annualized 7.5%.
This brings us to the current decade with both equities and commodities starting strong, but with commodities ahead by an annualized 3.7%. As noted above, it’s rare to see both do well at the same time – and, if forced to pick one to continue the price appreciation, we take commodities. Of the two decades of strong commodity performance, the 1970s was driven more by supply constraints while the 1990s was a demand story. We see the current situation a mix of the two – supply challenges today with increased green-transition demand for industrial metals “tomorrow” – and maintain our tactical overweight to natural resources.
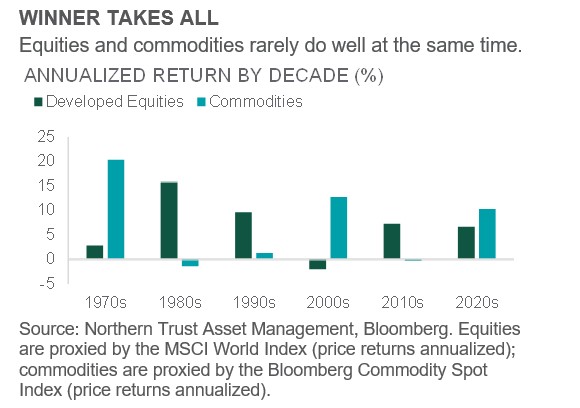
- It has been rare to see both equities and commodities post strong returns across the same decade.
- The setup for commodities looks attractive given both supply challenges and longer-term demand supports.
- We remain 3% overweight natural resources as a hedge to our emerging market equity underweight.
 Subscribe to Investment Perspective.
Unless noted otherwise, data in this piece is Sourced from Bloomberg as of september 2023.
For Asia-Pacific (APAC) and Europe, Middle East and Africa (EMEA) markets, this information is directed to institutional, professional and wholesale clients or investors only and should not be relied upon by retail clients or investors.
© 2023 Northern Trust Corporation. Head Office: 50 South La Salle Street, Chicago, Illinois 60603 U.S.A. The information contained herein is intended for use with current or prospective clients of Northern Trust Investments, Inc (NTI) or its affiliates. The information is not intended for distribution or use by any person in any jurisdiction where such distribution would be contrary to local law or regulation. Northern Trust Asset Management’s (NTAM) and its affiliates may have positions in and may effect transactions in the markets, contracts and related investments different than described in this information. This information is obtained from sources believed to be reliable, its accuracy and completeness are not guaranteed, and is subject to change. Information does not constitute a recommendation of any investment strategy, is not intended as investment advice and does not take into account all the circumstances of each investor. Forward-looking statements and assumptions are NTAM’s current estimates or expectations of future events or future results based upon proprietary research and should not be construed as an estimate or promise of results that a portfolio may achieve. Actual results could differ materially from the results indicated by this information
This report is provided for informational purposes only and is not intended to be, and should not be construed as, an offer, solicitation or recommendation with respect to any transaction and should not be treated as legal advice, investment advice or tax advice. Recipients should not rely upon this information as a substitute for obtaining specific legal or tax advice from their own professional legal or tax advisors. References to specific securities and their issuers are for illustrative purposes only and are not intended and should not be interpreted as recommendations to purchase or sell such securities. Indices and trademarks are the property of their respective owners. Information is subject to change based on market or other conditions.
All securities investing and trading activities risk the loss of capital. Each portfolio is subject to substantial risks including market risks, strategy risks, advisor risk, and risks with respect to its investment in other structures. There can be no assurance that any portfolio investment objectives will be achieved, or that any investment will achieve profits or avoid incurring substantial losses. No investment strategy or risk management technique can guarantee returns or eliminate risk in any market environment. Risk controls and models do not promise any level of performance or guarantee against loss of principal. Any discussion of risk management is intended to describe NTAM’s efforts to monitor and manage risk but does not imply low risk.
Past performance is not a guarantee of future results. Performance returns and the principal value of an investment will fluctuate. Performance returns contained herein are subject to revision by NTAM. Comparative indices shown are provided as an indication of the performance of a particular segment of the capital markets and/or alternative strategies in general. Index performance returns do not reflect any management fees, transaction costs or expenses. It is not possible to invest directly in any index. Net performance returns are reduced by investment management fees and other expenses relating to the management of the account. Gross performance returns contained herein include reinvestment of dividends and other earnings, transaction costs, and all fees and expenses other than investment management fees, unless indicated otherwise. For additional information on fees, please refer to Part 2a of the Form ADV or consult an NTI representative.
Forward-looking statements and assumptions are NTAM’s current estimates or expectations of future events or future results based upon proprietary research and should not be construed as an estimate or promise of results that a portfolio may achieve. Actual results could differ materially from the results indicated by this information.
Northern Trust Asset Management is composed of Northern Trust Investments, Inc. Northern Trust Global Investments Limited, Northern Trust Fund Managers (Ireland) Limited, Northern Trust Global Investments Japan, K.K, NT Global Advisors, Inc., 50 South Capital Advisors, LLC, Northern Trust Asset Management Australia Pty Ltd, and investment personnel of The Northern Trust Company of Hong Kong Limited and The Northern Trust Company. P-091923-3121146-091824

Weekly Investment Commentary: Munis offer yield relief from inflation’s heat
U.S. yields began the year at their highest starting level since 2011, and they have since risen further across the Treasury and municipal curves.

Global Weekly Commentary: Higher bar for U.S. earnings to deliver
We saw 2024 as a year of two stories. First, cooling inflation and solid corporate earnings would support upbeat risk appetite.

Global Markets Weekly Update: April 19, 2024
Review the performance of global stock and bond markets over the past week, along with relevant insights from T. Rowe Price economists and investment professionals.