
Investment Perspective: Signs of Stress
OUTLOOK
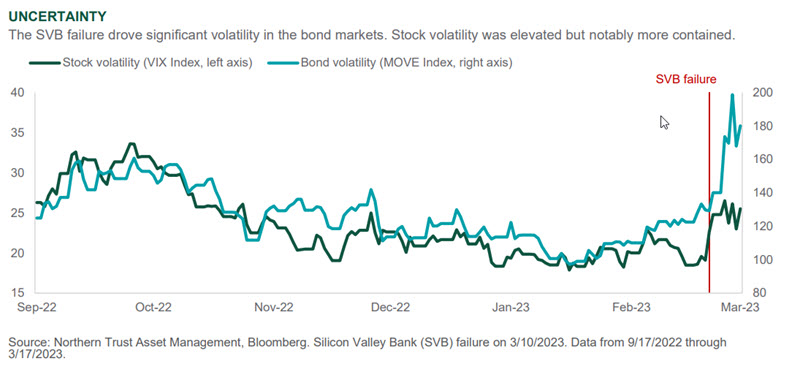
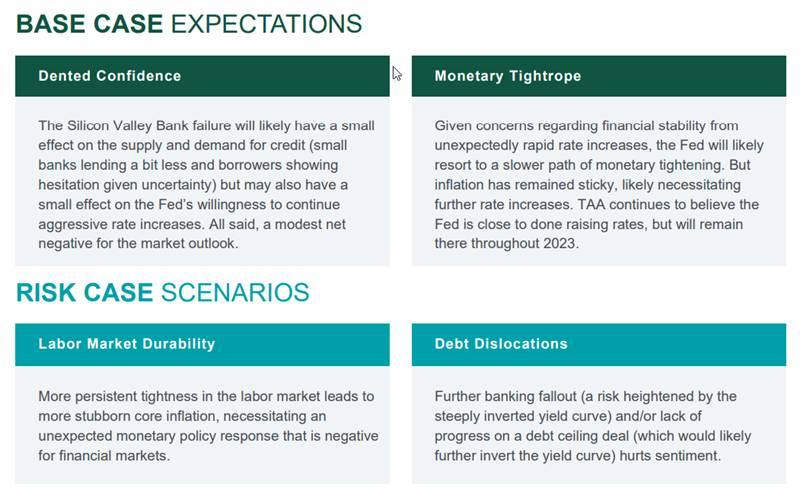
The surprise failure of Silicon Valley Bank (SVB) has brought fears of instability of the financial system, sending a shockwave of uncertainty across the capital markets. Very elevated volatility in Treasuries, including a dramatic drop in rates across the curve, highlight investor concerns regarding other potential “shoes to drop.” Equity markets have been more resilient, perhaps acknowledging critical differences to the financial crisis 15 years ago.
We do not think this is the same situation as the financial crisis of 2008. SVB was a unique institution exposed to relatively unique risks. While its failure has exposed underappreciated vulnerabilities, there are critical differences compared to 2008. Far more capital and liquidity combined with much better oversight have dramatically reduced systemic risk. The issues at SVB were “hidden in plain sight”, not accumulated through poor lending standards and off-balance-sheet or complex financial structures that magnified and obfuscated risks. Intervention from regulators to provide liquidity to banks should sufficiently protect the system, though financial markets will likely require the passage of time as proof.
We expect global markets will cycle through a list of potential worries, keeping volatility high in the near term. Stocks have held up surprisingly well in aggregate, perhaps aided by the drop in rates and changing expectations regarding the path for the Fed, as it and other central banks walk the tightrope of maintaining vigilance on inflation while preserving financial stability.
The duration of this period of uncertainty will have implications on future growth and inflation – the longer this takes to resolve, the larger the drag as businesses and consumers wait out the storm. Meanwhile, the labor market remained strong in February with over 300k new jobs added while wage growth cooled. Producer prices came in lower than expected, hopefully a leading indicator of continued disinflation. In the absence of SVB’s issues, investors would likely have greeted all of this favorably.
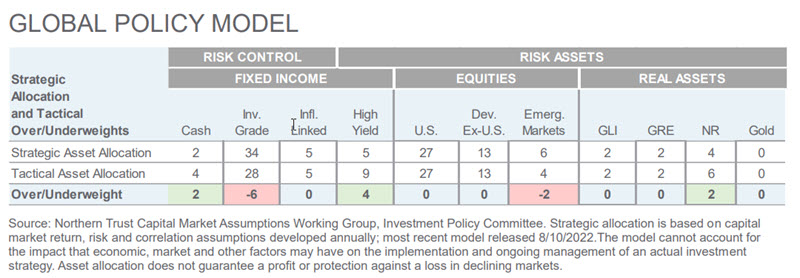
We maintained our Global Policy Model allocations this month and see a restoration of market confidence as the base case. We think markets have priced in too negative of an outcome in the fixed income markets, and thus kept our underweight to investment grade bonds and overweight to high yield. Developed market equities appear to fairly price the balance of risks, so we remain neutral. We remain underweight emerging markets with an offsetting overweight to natural resources.
INTEREST RATES
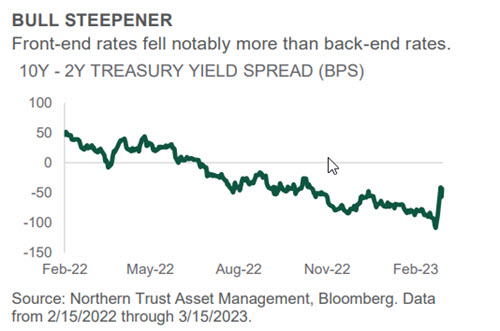
- While the timing is imperfect, a yield curve inversion has historically been a strong indicator of recession.
- Recent curve re-steepening was driven by decreased expectations for central bank tightening – not lower recession probabilities.
- Given elevated rate volatility and declines that we view as overdone, we remain underweight term risk.
Treasury yields across the curve have been on a wild ride over the past month. Sharp swings in expectations for monetary policy have whipsawed yields at the front end of the curve. Fed Chair Powell's semi-annual testimony to Congress seemed to open the door to the possibility of a 50 basis point (bp) rate hike at the March meeting. With the failure of Silicon Valley Bank a few days later and growing concerns around contagion in the banking system, markets quickly and dramatically reduced expectations for future rate hikes. Economic data measuring inflation and the labor market have generally exceeded market expectations over that same period, preserving hopes for continued economic growth in the medium term.
The yield curve increasingly inverted over the past eight months before the magnitude of inversion reached multi-decade highs shortly after Powell’s Congressional testimony. Only days later, with the rapid repricing of monetary policy, the curve steepened sharply and brought the inversion to less than 50 bps. While inversions are often closely watched as a potential recession indicator, the dramatic reversal in the magnitude of curve inversion signals – at the very least – a rapidly evolving market environment marked by elevated interest rate volatility.
CREDIT MARKETS
- Bouts of financial market distress often bring asset class liquidity considerations to the forefront.
- Within high yield, less-traded securities can present alpha opportunities as they take longer to reprice.
- Liquidity conditions have held up well during recent turmoil. We still like high yield as a less-risky risk asset.
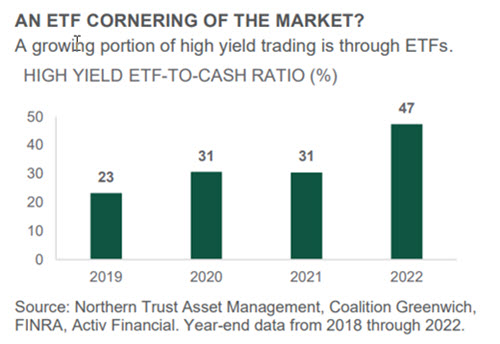
With heightened uncertainty around inflation and the extent of further rate hikes, macro volatility will likely continue to be elevated over the course of the year. As we will explain below, this presents opportunity for excess return in the less-liquid segments of the bond market. One way to identify more-liquid bonds (and, in turn, less-liquid bonds) is to find those that are present in exchange-traded funds (ETFs). The ETF-to-cash ratio is a useful tool to illustrate the importance of this in high yield. Here we define the ETF-to-cash ratio as the volume traded in high yield ETFs as a percent of the high yield market’s total trading volume.
As of the end of 2022, the high yield ETF-to-cash ratio sat at 47% (see chart). While it has increased over recent years, this means that roughly half of the high yield market’s trading volume still sits outside of ETFs. Put differently, a meaningful portion (~50%) of the high yield market trades in relatively less liquid and followed areas and can therefore take longer to reprice. This presents opportunity for active investors to capitalize on mispricing. Fundamental credit work and security selection is paramount to generating excess returns in the less efficient market segments – especially alongside elevated volatility.
EQUITY MARKETS
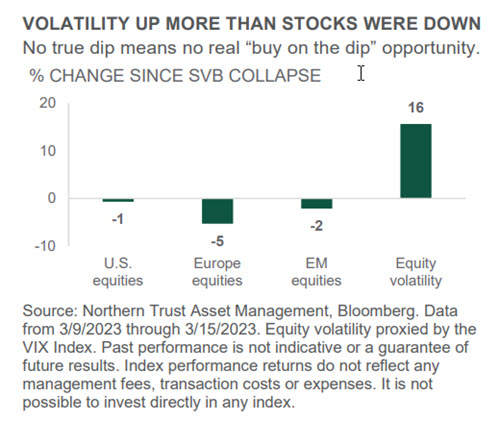
- Banking system disorder sent equity market volatility higher, though not far above 2022’s average level.
- Aggregate equity price declines have been contained so far, limiting any “buy the dip” opportunities.
- We are modestly underweight equities as we maintain a cautious approach to a fluid and volatile backdrop.
Global equities declined roughly 5% over the past month. The weakness originally reflected increased expectations for central bank tightening as economic datapoints topped expectations and threatened ongoing progress on inflation. Equities later declined on unease over the failure of Silicon Valley Bank (SVB) and broader bank turmoil. Value lagged growth as the latter benefited from the swift decline in interest rates that ensued upon the bank issues. While all major regions were down on the month, Europe led the U.S., followed by emerging markets (EM). After a strong start to the year, EM has lagged due to uncertainty on China’s growth outlook beyond the reopening bounce.
The SVB collapse triggered a flood of volatility, to which equity markets were certainly exposed. However, in the context of higher volatility – and relative to meaningful fixed income movements – equity price declines were somewhat contained (see chart). The degree of the declines appears to align with our initial read of the situation; specifically that the bank turmoil likely does not represent systemic failure. However, we appreciate the fluidity of the situation and the resulting balance of both upside and downside risks. With high volatility and no major perceived dislocation in prices, we made no changes to our tactical equity positioning.
REAL ASSETS
- A mild winter, efficient energy usage and slower global growth have pushed energy prices meaningfully lower.
- Since the onset of Ukraine war risks, natural resources (NR) has still handily outperformed other risk assets.
- We remain overweight NR given a positive medium-term outlook and for participation in any China upside.
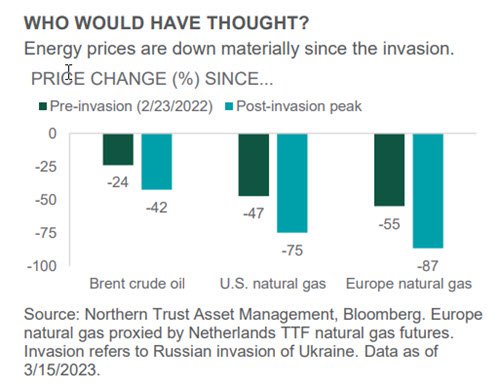
A bit over a year ago Russia commenced its (unjustified) invasion of Ukraine. At the time, concerns surrounded what the war would mean for commodity prices, specifically oil and natural gas. Most investors around at that time would no doubt be surprised by the nearby chart. Brent crude oil prices (the global proxy) is down 42% from the post-invasion peak. U.S. natural gas prices are down 75% from their peak and European natural gas prices are down 87%. A confluence of developments (and some luck) are at play: 1.) a mild winter across many parts of the world (notably Europe); 2.) a heroic effort on the part of the Europeans in filling up their natural gas reserves (currently near-record levels); and 3.) the general global economic slowdown.
Despite much lower energy prices than would have been expected (feared) a year ago, natural resources (the asset class) has performed relatively well. Since the beginning of 2022 – when Russia started to appear on investor risk case lists – natural resources are up 4% (-17% for global equity markets). Tight supply/demand and geopolitical risk keep us overweight the asset class, despite the economic slowdown. Additionally, the overweight should provide some hedge against our emerging market equity underweight should the China rebound story resume.
Chris Shipley, Chief Investment Strategist – North America
See our latest insights and research.
FOR ASIA-PACIFIC MARKETS, THIS INFORMATION IS DIRECTED TO INSTITUTIONAL, PROFESSIONAL AND WHOLESALE CLIENTS OR INVESTORS ONLY AND SHOULD NOT BE RELIED UPON BY RETAIL CLIENTS OR INVESTORS.
© 2023 Northern Trust Corporation. Head Office: 50 South La Salle Street, Chicago, Illinois 60603 U.S.A. The information is not intended for distribution or use by any person in any jurisdiction where such distribution would be contrary to local law or regulation. This information is obtained from sources believed to be reliable, and its accuracy and completeness are not guaranteed. Information does not constitute a recommendation of any investment strategy, is not intended as investment advice and does not take into account all the circumstances of each investor. Forward-looking statements and assumptions are Northern Trust’s current estimates or expectations of future events or future results based upon proprietary research and should not be construed as an estimate or promise of results that a portfolio may achieve. Actual results could differ materially from the results indicated by this information. Investments can go down as well as up.
This report is provided for informational purposes only and is not intended to be, and should not be construed as, an offer, solicitation or recommendation with respect to any transaction and should not be treated as legal advice, investment advice or tax advice. Recipients should not rely upon this information as a substitute for obtaining specific legal or tax advice from their own professional legal or tax advisors. References to specific securities and their issuers are for illustrative purposes only and are not intended and should not be interpreted as recommendations to purchase or sell such securities. Indices and trademarks are the property of their respective owners. Information is subject to change based on market or other conditions.
No investment strategy or risk management technique can guarantee returns or eliminate risk in any market environment. Risk controls and models do not promise any level of performance or guarantee against loss of principal. Any discussion of risk management is intended to describe Northern Trust’s efforts to monitor and manage risk but does not imply low risk.
Past performance is not guarantee of future results. Performance returns and the principal value of an investment will fluctuate. Performance returns contained herein are subject to revision by Northern Trust. Comparative indices shown are provided as an indication of the performance of a particular segment of the capital markets and/or alternative strategies in general. Index performance returns do not reflect any management fees, transaction costs or expenses. It is not possible to invest directly in any index. Net performance returns are reduced by investment management fees and other expenses relating to the management of the account. Gross performance returns contained herein include reinvestment of dividends and other earnings, transaction costs, and all fees and expenses other than investment management fees, unless indicated otherwise. For additional information on fees, please refer to Part 2a of the Form ADV or consult a Northern Trust representative.
Forward-looking statements and assumptions are Northern Trust’s current estimates or expectations of future events or future results based upon proprietary research and should not be construed as an estimate or promise of results that a portfolio may achieve. Actual results could differ materially from the results indicated by this information.
Northern Trust Asset Management is composed of Northern Trust Investments, Inc., Northern Trust Global Investments Limited, Northern Trust Fund Managers (Ireland) Limited, Northern Trust Global Investments Japan, K.K., NT Global Advisors, Inc., 50 South Capital Advisors, LLC, Belvedere Advisors LLC, Northern Trust Asset Management Australia Pty Ltd, and investment personnel of The Northern Trust Company of Hong Kong Limited and The Northern Trust Company.

Weekly Investment Commentary: Munis offer yield relief from inflation’s heat
U.S. yields began the year at their highest starting level since 2011, and they have since risen further across the Treasury and municipal curves.

Global Weekly Commentary: Higher bar for U.S. earnings to deliver
We saw 2024 as a year of two stories. First, cooling inflation and solid corporate earnings would support upbeat risk appetite.

Global Markets Weekly Update: April 19, 2024
Review the performance of global stock and bond markets over the past week, along with relevant insights from T. Rowe Price economists and investment professionals.