
Investment Perspective: Watching Wages
OUTLOOK
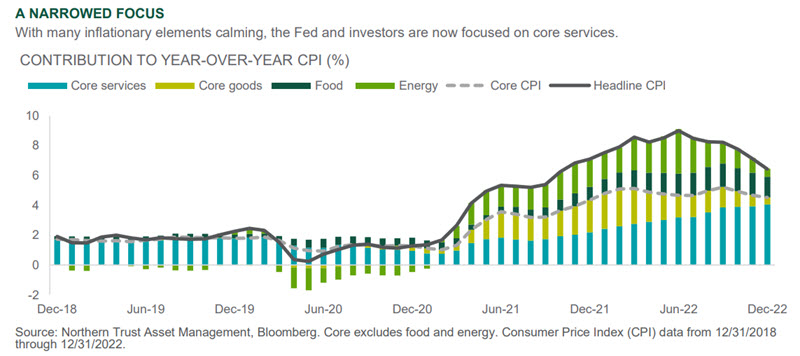
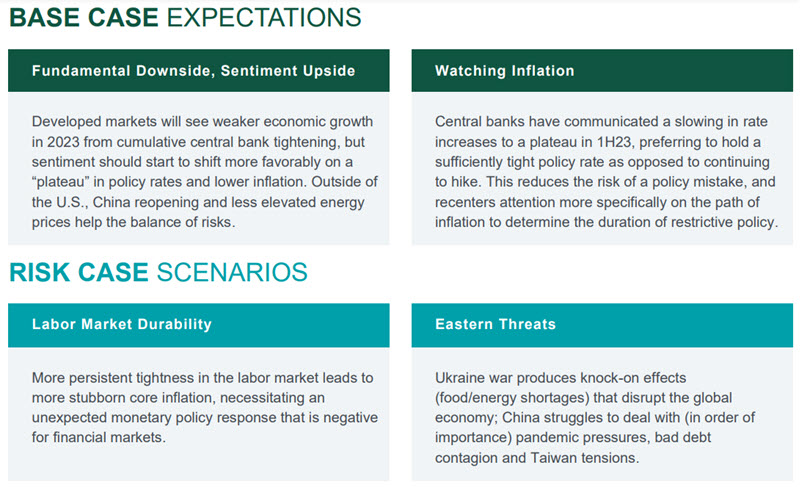
As inflation continues to moderate, attention has shifted to a narrower aspect of the price story – non-shelter services inflation. This component represents the aspect of inflation most closely tied to wage growth, and is proving the most resistant to central bank (particularly the Federal Reserve) taming. The labor market remains tight, with the most recent employment report in the U.S. displaying continued strength in hiring and a lower unemployment rate. Importantly, wage growth slowed and the prior month was revised lower – but remains elevated. We believe inflation will continue to decline over the course of 2023, but that labor market dynamics could prevent inflation from falling to levels that represent a declaration of victory for the Fed, representing a risk to financial market expectations. In the meantime, it should be expected that the Fed will continue to lean hawkishly to maintain credibility and keep long-term inflation expectations in check.
Internationally, the economic outlook appears incrementally better than the recent trajectory, reflecting a warmer winter bringing down energy costs in Europe and China ending its zero-Covid policy. We still see a recession as likely in Europe and higher than 50/50 odds in the U.S. as economies feel the full weight of central bank tightening to date, and that left to come. The forward-looking nature of the market suggests weakening economies in developed markets will be weighed against the sentiment benefits of declining inflation and pauses in monetary tightening likely in the first half of 2023. We agree with the market’s pricing of a roughly 5% terminal rate for the Fed, while we see the European Central Bank (ECB) raising rates somewhat less than suggested in their surprisingly hawkish statement last month. China’s economic reopening will very likely experience unevenness and setbacks, and secular headwinds remain considerable, but a 2023 recovery could move some long-term investor concerns to the back burner this year.
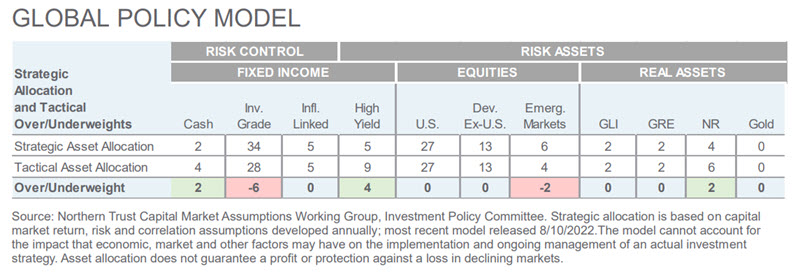
We reduced the size of our underweight to emerging market equities in our Global Policy Model (GPM) this month to reflect the upside economic opportunity associated with the winding down of China’s zero-Covid policy, funded by a reduction to our overweight to high yield bonds. With our expectation that the weaker economic picture in the developed world will be balanced against improving sentiment, we are neutral developed market equities in the GPM. We are underweight investment grade bonds and modestly underweight emerging market equities, while being over overweight high yield bonds and modestly overweight cash.
INTEREST RATES
- Markets are sniffing out some monetary relief, but we don’t believe the Fed will be cutting in 2023.
- Headline inflation is coming down but core (especially services) inflation has the market’s attention.
- We are fairly neutral duration in fixed income strategies given what we believe are fairly priced markets.
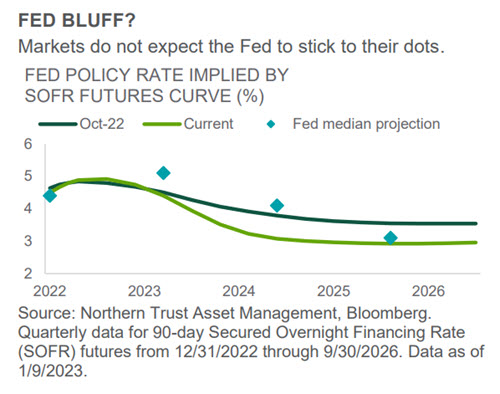
Although the Federal Reserve slowed the pace of tightening last month, they raised their estimate of the 2023 Fed funds rate while 18 of 19 participants projected a 2025 rate at least 50 basis points above their long-run estimate (2.5%). Chair Powell noted that an unwarranted loosening of financial conditions would not be viewed favorably. Rates generally increased through year end, however since then they have declined with the bulk of the move coming alongside weaker than expected economic data. Market pricing is still inconclusive regarding the odds of a recession in 2023, but expectations for slower growth and inflation have investors looking for looser policy.
Commodity prices have declined rapidly and pandemic affected supply chains have mostly healed, but core services inflation remains robust and several jobs datapoints suggest a still tight labor market. The Fed views this as reason to not relent on its inflation fighting policies, while the market is now seemingly questioning this resolve. Per the chart to the right, investors and the Fed were mostly aligned in October, but the divergence is now wider than at any point in the last year. How this is resolved leads to divergent outcomes in rates and risk markets which keeps us closer to home in our tactical positioning.
CREDIT MARKETS
- Fundamentals and technicals across high yield markets in aggregate remain constructive.
- An 8%+ yield looks attractive given our lower default expectations vis-à-vis what the markets are pricing.
- While we reduced high yield slightly, the asset class remains our highest conviction overweight.
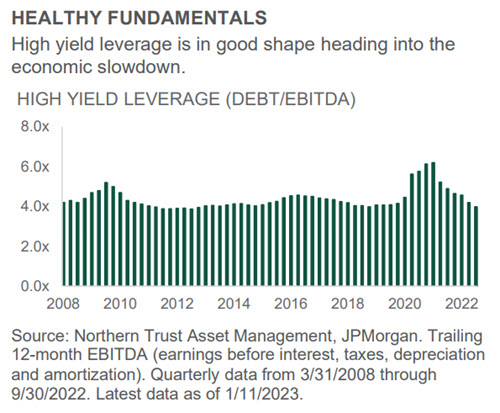
With heightened uncertainty around future growth and inflation, investors have questioned holding riskier parts of the credit market. However, balance sheets for high yield issuers are in a strong state heading into a more challenging fundamental landscape for corporate entities. One of the most important drivers of performance in the high yield asset class is the underlying fundamentals. Per the chart on the right, leverage has declined for the 6th consecutive quarter to its lowest level since 2012. In the third quarter of last year, leverage of high yield issuers decreased to 3.98x from 4.20x in the second quarter and 6.20x in the first quarter of 2021. Moreover, interest coverage metrics increased 0.2x to a record high 5.85x.
Compared to 2008 and 2020, interest coverage today is meaningfully higher than it was heading into those periods. With this in mind, high yield should fare relatively better in a downturn scenario today and we expect realized forward default rates to be below market estimates for 2023. The growth and inflation outlook is uncertain, but given positive supply technicals and strong fundamentals high yield valuations look compelling. While we slightly reduced our overweight to fund a narrowed underweight to emerging market equities, we remain positive on high yield overall.
EQUITY MARKETS
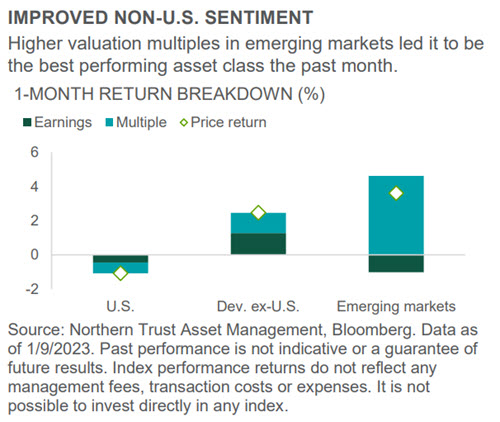
- Emerging market equities (EM) are getting a bounce after a very poor 2022.
- EM’s recent outperformance could be short-lived if China pandemic reopening issues linger.
- Our EM underweight has been reduced as sentiment has improved but we still prefer developed markets.
Global equities were volatile but ended with a small positive return over the past month. Underneath the surface emerging market equities went from laggard to leader while developed ex-U.S. equities continued to outperform U.S. equities. Emerging market equities benefited from China dropping its zero-Covid policy and financial markets looking beyond the current disruption toward a future economic bounce. This also somewhat benefited developed ex-U.S. equities, but a large decline in energy prices was likely a bigger driver. Due to a mix of adaptation and mild weather, the headwind from higher energy prices has been notably reduced. As a result, the growth outlook has incrementally improved and inflation is expected to fall quickly, providing a strong tailwind to European equities in particular.
The trend of value outperforming growth continued last month as investors remained unconvinced that valuations have truly bottomed. Looking forward, the economic outlook for Europe and China has improved due to lower energy prices and the prospect of reopening and we have continued to add to those equity markets. That means our underweight to global equities has been reduced, as well as our preference for developed markets over emerging.
REAL ASSETS
- Natural resources (NR) now have a growth element to them, but are still fairly inexpensive.
- Listed infrastructure (LI) and real estate (RE) remain beholden to the path of (still volatile) interest rates.
- We maintain our modest overweight to NR and our equal-weights to LI and RE in the Global Policy Model.
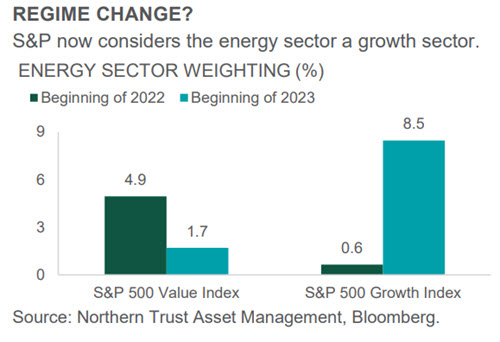
We enter 2023 with an overweight to real assets – focused in the natural resources (NR) space (with equal-weight positions in listed infrastructure and real estate). The supply/demand picture across many commodities remains tight – notably within the energy sector, thanks to Ukraine war-related disruptions and lack of investment in new supply sources. Also relevant are the dynamics around the U.S. Strategic Petroleum Reserve (SPR) – while any refill of the SPR in 2023 meets logistical challenges, no longer will it be a notable supply source and could help to put a floor under oil prices over the coming years. A more stable – and sufficiently high – oil price level could translate into robust returns for NR in 2023. Even after a solid 2022 (up ~10%), NR looks inexpensive – below normal valuation ranges – thanks to recently strong earnings.
Despite what are still very inexpensive valuations, index provider Standard & Poor’s (S&P) now assigns a greater weight to energy within its S&P 500 growth index than its value index thanks to energy’s price momentum last year (other index providers don’t include a momentum factor). While mostly a fun fact, on a practical level it is an example of why we include a dedicated NR exposure as opposed to simply taking on a value tilt to get energy exposure.
See our latest insights and research
- Chris Shipley, Chief Investment Strategist – North America
Unless noted otherwise, data in this piece is Sourced from Bloomberg as of January 2023.
FOR ASIA-PACIFIC MARKETS, THIS INFORMATION IS DIRECTED TO INSTITUTIONAL, PROFESSIONAL AND WHOLESALE CLIENTS OR INVESTORS ONLY AND SHOULD NOT BE RELIED UPON BY RETAIL CLIENTS OR INVESTORS.
© 2023 Northern Trust Corporation. Head Office: 50 South La Salle Street, Chicago, Illinois 60603 U.S.A. The information is not intended for distribution or use by any person in any jurisdiction where such distribution would be contrary to local law or regulation. This information is obtained from sources believed to be reliable, and its accuracy and completeness are not guaranteed. Information does not constitute a recommendation of any investment strategy, is not intended as investment advice and does not take into account all the circumstances of each investor. Forward-looking statements and assumptions are Northern Trust’s current estimates or expectations of future events or future results based upon proprietary research and should not be construed as an estimate or promise of results that a portfolio may achieve. Actual results could differ materially from the results indicated by this information. Investments can go down as well as up.
This report is provided for informational purposes only and is not intended to be, and should not be construed as, an offer, solicitation or recommendation with respect to any transaction and should not be treated as legal advice, investment advice or tax advice. Recipients should not rely upon this information as a substitute for obtaining specific legal or tax advice from their own professional legal or tax advisors. References to specific securities and their issuers are for illustrative purposes only and are not intended and should not be interpreted as recommendations to purchase or sell such securities. Indices and trademarks are the property of their respective owners. Information is subject to change based on market or other conditions.
No investment strategy or risk management technique can guarantee returns or eliminate risk in any market environment. Risk controls and models do not promise any level of performance or guarantee against loss of principal. Any discussion of risk management is intended to describe Northern Trust’s efforts to monitor and manage risk but does not imply low risk.
Past performance is not guarantee of future results. Performance returns and the principal value of an investment will fluctuate. Performance returns contained herein are subject to revision by Northern Trust. Comparative indices shown are provided as an indication of the performance of a particular segment of the capital markets and/or alternative strategies in general. Index performance returns do not reflect any management fees, transaction costs or expenses. It is not possible to invest directly in any index. Net performance returns are reduced by investment management fees and other expenses relating to the management of the account. Gross performance returns contained herein include reinvestment of dividends and other earnings, transaction costs, and all fees and expenses other than investment management fees, unless indicated otherwise. For additional information on fees, please refer to Part 2a of the Form ADV or consult a Northern Trust representative.
Forward-looking statements and assumptions are Northern Trust’s current estimates or expectations of future events or future results based upon proprietary research and should not be construed as an estimate or promise of results that a portfolio may achieve. Actual results could differ materially from the results indicated by this information.
Northern Trust Asset Management is composed of Northern Trust Investments, Inc., Northern Trust Global Investments Limited, Northern Trust Fund Managers (Ireland) Limited, Northern Trust Global Investments Japan, K.K., NT Global Advisors, Inc., 50 South Capital Advisors, LLC, Belvedere Advisors LLC, Northern Trust Asset Management Australia Pty Ltd, and investment personnel of The Northern Trust Company of Hong Kong Limited and The Northern Trust Company.

Weekly Investment Commentary: Earnings season: investment ideas
First-quarter earnings season has kicked off with the utilities and communication services sectors projected to deliver the strongest year-over-year EPS growth, while estimates for materials and energy are expected to decline the most.

Global Weekly Commentary: Earnings growth not just about tech
Solid U.S. economic and corporate earnings growth have supported risk appetite, driving stocks to all-time highs – even as bond yields have jumped. We think earnings will need to deliver on high expectations, especially after last week’s data showing sticky inflation spooked investors.

Global Markets Weekly Update: April 12, 2024
Review the performance of global stock and bond markets over the past week, along with relevant insights from T. Rowe Price economists and investment professionals.