
The Five Stages of a Market Crisis
KEY INSIGHTS
- The Kübler‑Ross model outlines a series of emotions experienced by terminally ill patients and the recently bereaved. A similar process can be observed in market crises.
- I believe the coronavirus crisis is currently in the “depression” stage, at which assets have adjusted in line with the new reality.
- The “acceptance” stage will only arrive when infection rates drop and the end of lockdowns and social distancing is in sight, which could still be months away.
The Kübler‑Ross model, also known as the five stages of grief, famously outlines a series of emotions experienced by terminally ill patients prior to death or by people who have lost a loved one. Beginning with denial, the model describes paths through each subsequent stage: anger, bargaining, depression, and acceptance. In my view, a similar sentimental process—with a few adjustments—can be observed in market crises, including the present one, where I believe we are in the “depression” stage.
Let’s look at each stage in turn.
Denial
With the benefit of hindsight, we were in denial for quite some time. In the summer of 2019, the U.S. yield curve inverted when the spread between yields of 10‑year Treasury notes and three‑month Treasury bills dropped to almost ‑50bps.1 Using the Federal Reserve Bank of New York method for calculating probability of a U.S. recession 12 months forward, the U.S. yield curve assigned around a 30% probability of a recession in February 2020. This may not sound very high, but the last two occasions it reached such levels during the past 30 years were at the beginning of the recession in 2000 and just before the 2008 global financial crisis (Figure 1).
While the bond market did not predict the coronavirus pandemic, it did warn us that something bad might happen in markets. More importantly, however, when the coronavirus ravaged China, the West remained in denial. We watched as China put Hubei province into quarantine, built a hospital in a week, closed Wuhan, and shut down the national economy. We thought the coronavirus was nothing more than flu with more aggressive PR. To fully understand the crisis, we had to see it with our own eyes in Europe and then in the U.S.—only then could we stop denying it.
THE U.S. YIELD CURVE SIGNALED A RECESSION LAST SUMMER
(Fig. 1) The probability of a U.S. recession, using the New York Fed’s model
As of March 31, 2020.
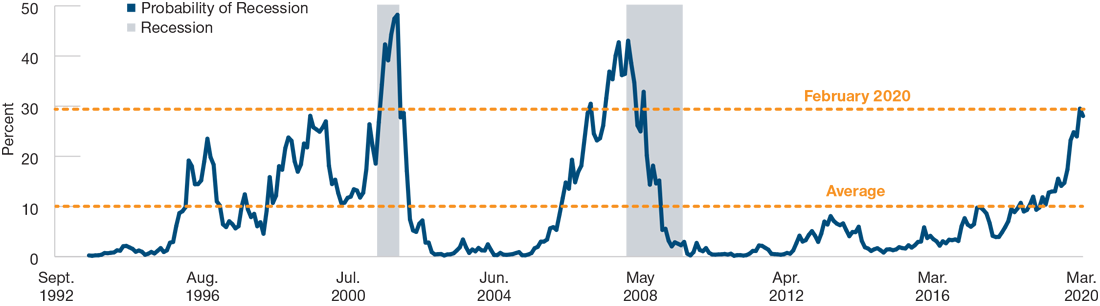
Sources: Federal Reserve Bank of New York, The Yield Curve as a Leading Indicator, https://www.newyorkfed.org/research/capital_markets/ycfaq.html, with analysis by T. Rowe Price. Based on U.S. generic spread rates September 1992 through March 2020. The shaded areas indicate periods designated as recessions. Actual outcomes may vary.
Anger
Bear markets typically begin with a steep drop in the prices of risk assets—panic or fear would perhaps be more appropriate words than anger. When confidence is lost, sentiment turns sour and investors dump risk assets in favor of conservative investments. Liquidity evaporates, making things worse.
"We thought the coronavirus was nothing more than flu with more aggressive PR."
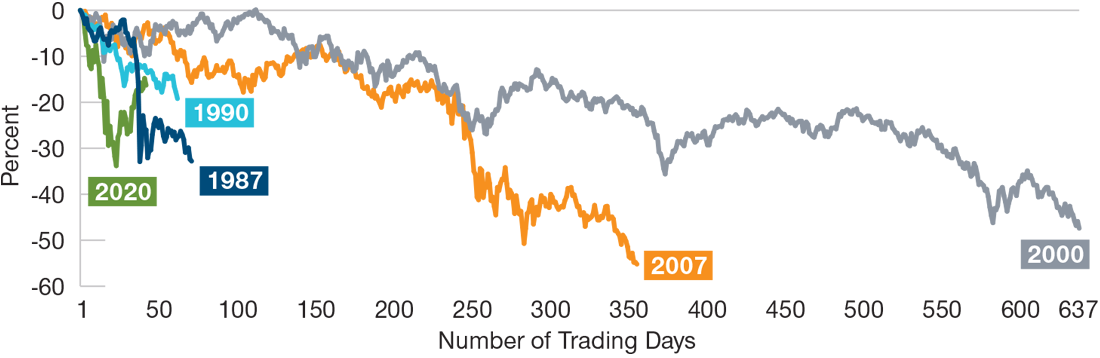
On February 20, 2020, the drawdown in risk assets began, sending the MSCI All Country World Index (ACWI) down 33% and global high yield indices down more than 20% by March 24. Yields of high‑quality government bonds (e.g., those of the U.S., Germany, and the UK) reached all‑time lows, and “safe‑haven” currencies, such as the U.S. dollar and Japanese yen, appreciated. The descent into bear market territory of the S&P 500 was more rapid than ever previously witnessed—perhaps because of the surprising shock of the virus, perhaps because it started from all‑time highs of stock markets, and/or perhaps because algorithm trading exacerbated the selling (see Figure 2). In the angry stage, markets quickly price in doom and gloom. This initial stage of an angry meltdown now appears to be behind us.
THIS YEAR’S RECORD DESCENT INTO BEAR MARKET TERRITORY
(Fig. 2) Cumulative total returns of selected bear markets of the S&P 500
As of April 20, 2020.
Past performance is not a reliable indicator of future performance.
Source: Standard and Poor’s S&P 500 Index (see Additional Disclosures), with analysis by T. Rowe Price. January 1960 through April 20, 2020. The x-axis is the number of trading days from the peak to the trough of the decline, except for the 2020 bear market where the x-axis is the number of trading days from February 19, 2020, to April 20, 2020. A bear market is defined as a drop of 20% or more from the peak. The figure shows only a few selected bear markets of the S&P 500 since 1960.
Bargaining
Bargaining has two meanings in a market crisis. The first is the initial attempt to address and bargain with the unfolding crisis. With the coronavirus, central banks were quick to react to this crisis with unprecedented monetary stimulus. They prevented the situation from turning into a financial crisis by providing liquidity, purchasing assets, and printing money for governments. Then governments announced unprecedented fiscal stimulus and programs to support individuals, businesses, and the economies. They also took decisive measures to address the health crisis through travel bans, lockdowns, and social distancing. The actions of policymakers ensured that markets, instead of irrationally pricing in doom and gloom, resumed trying to weight probable scenarios and price them in.
The other form of bargaining is the market capitulation that occurs when markets are oversold and bargain hunters buy assets at depressed prices. When those who panicked have fled, we are left with three broad categories of investor: those who take the view that selling now is probably the wrong decision (because it crystallizes losses), those who add risk because prices are attractive (taking the view that it is a buying opportunity and risk assets are likely to recover), and those who entered the crisis with an overweight to risk assets and now aim to make back some of their losses by adding more risk in an attempt to outperform the recovery.
"It is not yet clear whether markets indeed reached their lows on March 23, 2020..."
Typically for a bear market, there is a rally following the initial sell‑off. In the week of March 23–27, 2020, ACWI delivered its best weekly return since 2008, and its recovery from its bottom on March 23, 2020, was over 25% until April 20, 2020. As the initial meltdown was unprecedentedly quick and steep, so was the rally.
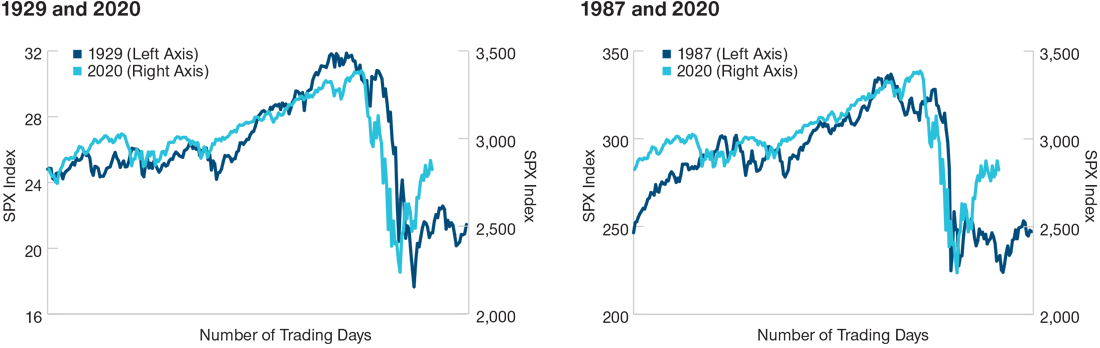
It is not yet clear whether markets indeed reached their lows on March 23, 2020, or whether the surge that followed was merely a bear market rally or a dead cat bounce—we will know that when we have the benefit of hindsight. In previous bear markets, stock markets have typically bounced after the initial fall only to retest their lows again later—often several times (see Figure 3). While we may have started a bottoming process, volatility needs to recede before we can say with certainty that the worst of the stock market downturn is behind us. The stage of bargaining may be over, or we may have a W‑shaped bargaining stage with rally, sell-off, and another rally.
IN PREVIOUS BEAR MARKETS, LOWS HAVE TYPICALLY BEEN RETESTED
(Fig. 3) Cumulative total returns of the S&P 500 in the 1929, 1987, and 2020 bear markets
As of April 20, 2020.
Past performance is not a reliable indicator of future performance.
Source: Standard and Poor’s S&P 500 Index (see Additional Disclosures), with analysis by T. Rowe Price. SPX Index = S&P 500 Index. Chart on the left: January 2, 1929, through December 31, 1929, and May 24, 2019, through April 20, 2020. Chart on the right: January 2, 1987, through December 31, 1987, and June 5, 2019, through April 20, 2020.
Depression
“Depression” is an ominous word in financial markets. However, markets are unlikely to enter an economic depression as a result of the coronavirus. Rather, the depression phase of this crisis refers to the adjustment of asset prices to the new reality as it unfolds. I believe that this is the stage we are at now—asset prices already reflect an unprecedented sharp recession in the first half of 2020 with a potential recovery—sharp or gradual—in the second half of 2020, largely thanks to the measures that policymakers have been implementing to address both the health crisis and the economic crisis.
The question that markets are now grappling with is: What is the likelihood of further negative or positive surprises? It is a difficult question to answer as there are so many unknowns. It seems we have enough monetary and fiscal stimulus to bridge the crisis and perhaps fuel the next expansion and bull market, but we may need a credible health strategy before it is safe for workers and consumers to return to normal activity. Until then, stock markets might struggle to find a firm bottom.
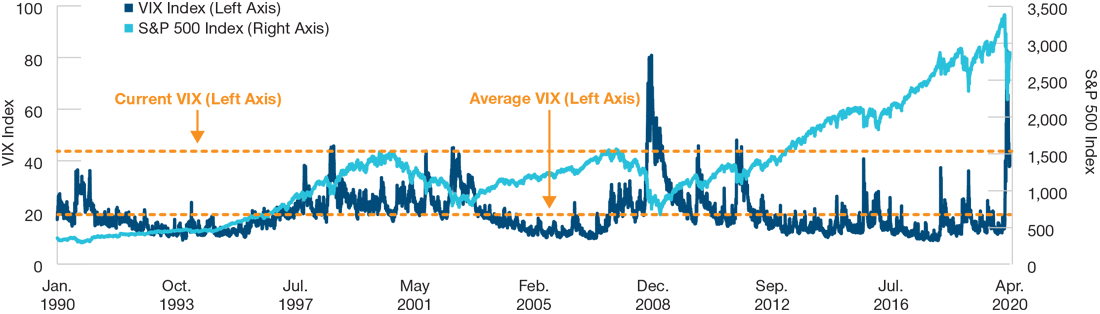
VOLATILITY IS AT A RECORD HIGH
(Fig. 4) The VIX and the S&P 500
As of April 20, 2020.
Past performance is not a reliable indicator of future performance.
Sources: Standard and Poor’s S&P 500 Index (see Additional Disclosures), and CBOE Volatility Index (VIX), © 2020 Cboe Exchange, Inc. All rights reserved. Analysis by T. Rowe Price. January 2, 1990, through April 20, 2020.
Although the CBOE Volatility Index (VIX) is significantly off its March 16 all‑time high, it is still at crisis levels, as Figure 4 shows. Volatility needs to come down, and we must have more clarity on the road ahead before the depression stage comes to an end.
From 1987 through April 20, 2020, the S&P 500 Index has had 315 days of extreme daily returns (over 2.5% or below ‑2.5%) out of 8,391 trading days. That’s 3.8%. Since February 20 this year, the S&P 500 has had 26 extreme daily returns out of 42 trading days—over 60%. This is over 16 times more than the long‑term average—clearly, the stock market is still unsettlingly swinging in the depression stage.
"We need to see a resolution of the health crisis on the horizon before a resolution of the economic crisis is possible."
Acceptance
The acceptance stage is the recovery, when markets price in the end of the crisis. The crisis does not need to actually end, but indicators should point to its end. The stock market is a machine that discounts probable scenarios. When we see that new infection rates are dropping and the end of lockdowns and social distancing is in sight, we believe risk assets are likely to accept the new normal and, as they have done after every crisis in history, begin to climb to new highs.
Are markets in the acceptance stage? Perhaps, but unlikely. We need to see a resolution of the health crisis on the horizon before a resolution of the economic crisis is possible. This may take a few weeks in an optimistic scenario or a few months in a base‑case scenario. We believe one thing is for sure: The acceptance stage will arrive.
WHAT WE’RE WATCHING NEXT
We are keeping a keen eye on the coronavirus crisis to determine whether there are any signals that the markets may be moving into the next stage. We continue to monitor markets for risks and investment opportunities—both of which are plentiful.
1 Credit spreads measure the additional yield that investors demand for holding a bond with credit risk over a similar‑maturity, high‑quality government security. A basis point is 0.01 percentage point.
Additional Disclosures
Copyright © 2020, S&P Global Market Intelligence (and its affiliates, as applicable). Reproduction of any information, data or material, including ratings (“Content”) in any form is prohibited except with the prior written permission of the relevant party. Such party, its affiliates and suppliers (“Content Providers”) do not guarantee the accuracy, adequacy, completeness, timeliness or availability of any Content and are not responsible for any errors or omissions (negligent or otherwise), regardless of the cause, or for the results obtained from the use of such Content. In no event shall Content Providers be liable for any damages, costs, expenses, legal fees, or losses (including lost income or lost profit and opportunity costs) in connection with any use of the Content. A reference to a particular investment or security, a rating or any observation concerning an investment that is part of the Content is not a recommendation to buy, sell or hold such investment or security, does not address the suitability of an investment or security and should not be relied on as investment advice. Credit ratings are statements of opinions and are not statements of fact.
Important Information
This material is provided for informational purposes only and is not intended to be investment advice or a recommendation to take any particular investment action.
The views contained herein are those of the authors as of May 2020 and are subject to change without notice; these views may differ from those of other T. Rowe Price associates.
This information is not intended to reflect a current or past recommendation, investment advice of any kind, or a solicitation of an offer to buy or sell any securities or investment services. The opinions and commentary provided do not take into account the investment objectives or financial situation of any particular investor or class of investor. Investors will need to consider their own circumstances before making an investment decision.
Information contained herein is based upon sources we consider to be reliable; we do not, however, guarantee its accuracy.
Past performance is not a reliable indicator of future performance. All investments are subject to market risk, including the possible loss of principal. All charts and tables are shown for illustrative purposes only. Actual future outcomes may differ significantly from any forward-looking statements made.
T. Rowe Price Investment Services, Inc.
© 2020 T. Rowe Price. All rights reserved. T. ROWE PRICE, INVEST WITH CONFIDENCE, and the bighorn sheep design are, collectively and/or apart, trademarks or registered trademarks of T. Rowe Price Group, Inc.

Direct Indexing and the IKEA Effect
The “IKEA effect” describes a cognitive bias that happens when people put in some form of labor to complete a project or finish a creation. Direct indexing won’t solve the behavior gap, but it has the potential to create better investor behaviors by allowing investors to play a larger role in the portfolio-building process.

Market Perspective: There are No Rewards Without Risk
2022 reminded investors of the risk from investing, but none of this makes losses palatable. As the old axiom goes, “there are no rewards without risk.” Here's perspective from Marta Norton, CIO, Americas, Morningstar Investment Management LLC.
The Unconscious Nudge: Behavioral science and its financial implications
Over the course of this presentation, we will talk about how the brain systems work and how it impacts decisions that people make.